Map
You can click on the Map  icon at the top of the page to open an incident map.
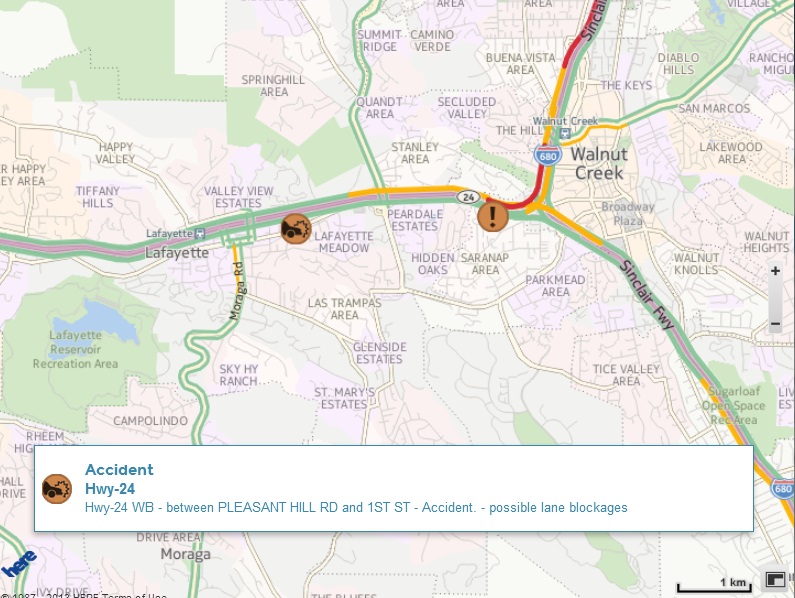
The map features color coded flow roads and incident icons plotted on the map. Click on any icon to see the specific details of the incident.
The map icons are also color coded based on severity:
The map features color coded flow roads and incident icons plotted on the map. Click on any icon to see the specific details of the incident.
The map icons are also color coded based on severity:
- Red icons = Severe
- Orange icons = Major/ Minor
- Grey icons = Cleared items
Customer support service by UserEcho
